Parabola, Scalings and Translations
Vertical scaling and reflection along with horizontal and vertical translations for the parabola can all happen in one equation using a, h. and k. So, our starting or reference parabola formula looks like this:
y = x2
And our equation that includes the scalings, reflections and translations looks like this:
y = a(x - h)2 + k
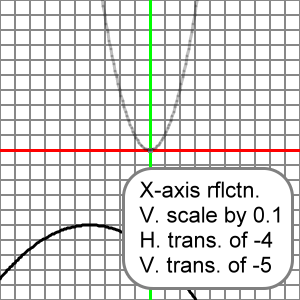
So, if a = -0.1 and h = -4 and k = -5, we say that the reference parabola is reflected across the x-axis and vertically scaled by a factor of 0.1 and horizontally translated -4 units and vertically translated -5 units. Our equation for this would appear:
y = (-0.1)(x - (-4))2 + (-5)
Or, with a bit of simplification:
y = -0.1(x + 4)2 - 5
Here's the graph for this transform. The reference parabola ( y = x2 ) is drawn in transparent light gray, and the transformed parabola which is reflected across the x-axis and vertically scaled by a factor of 0.1 and horizontally translated -4 units and vertically translated -5 units ( y = (-0.1)(x - (-4))2 + (-5) ) is drawn in black:
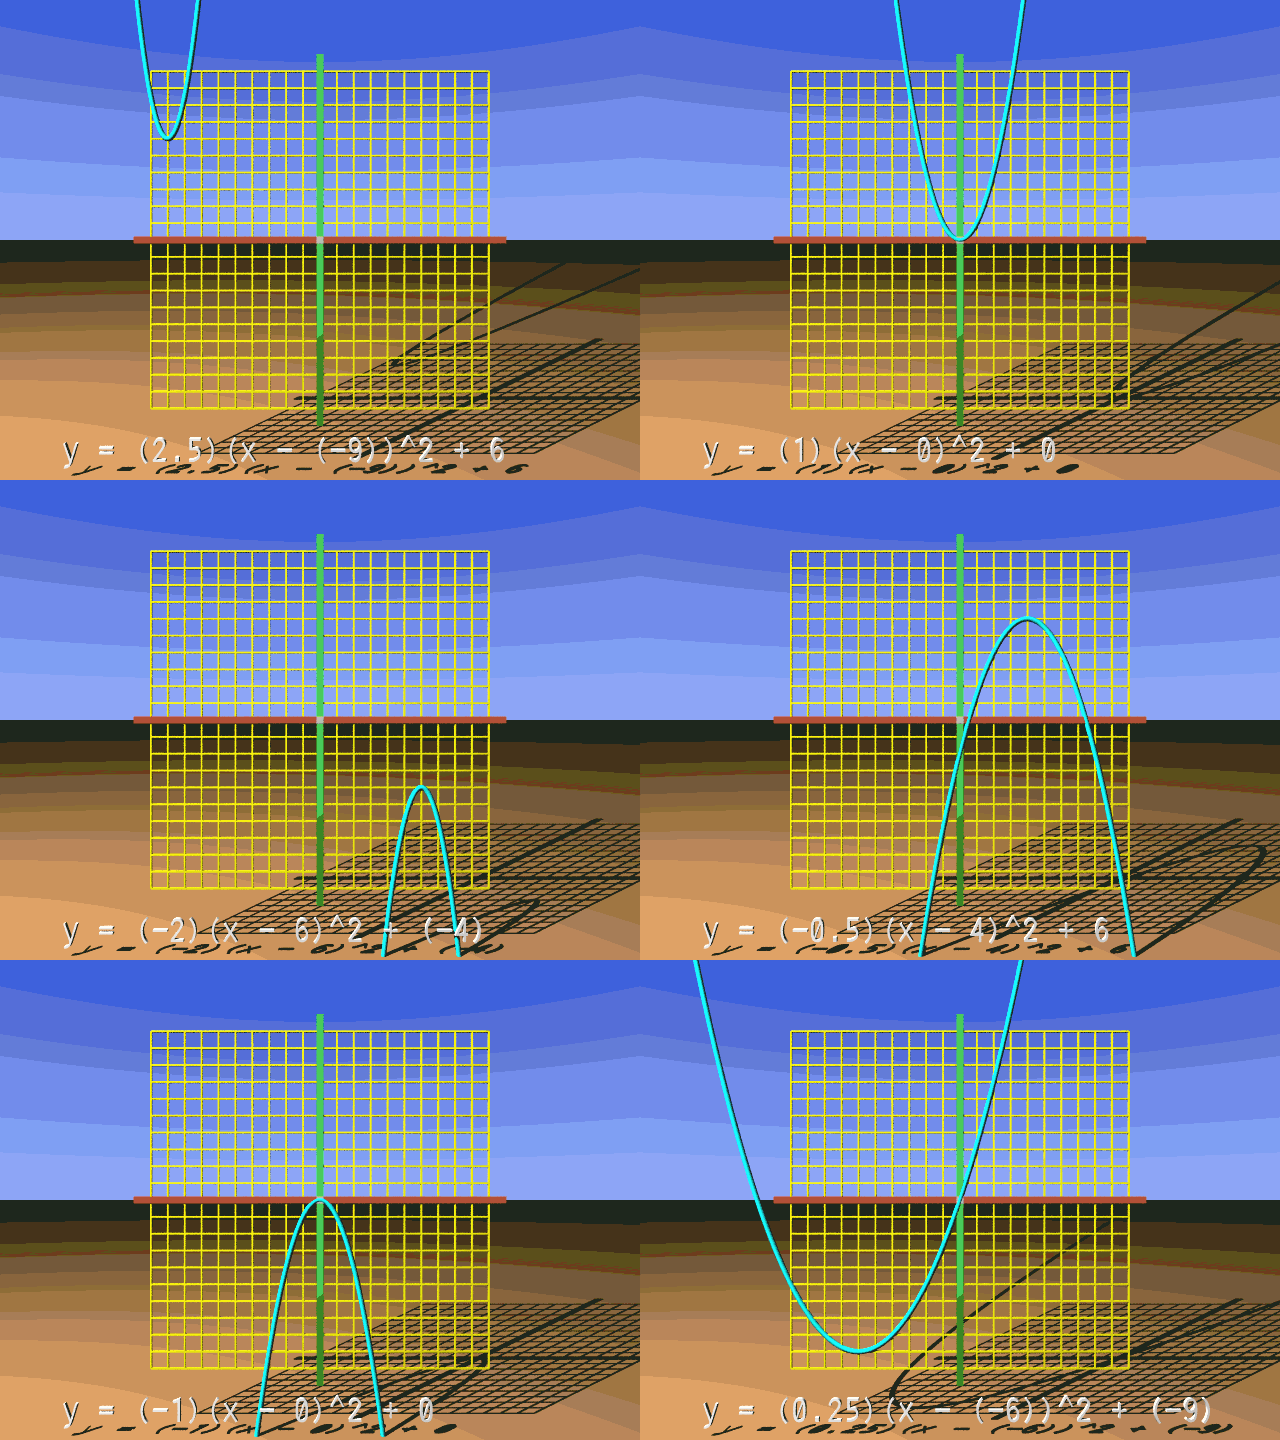
What follows is an animation that presents many x-axis reflections, and vertical scalings, and horizontal and vertical translations for our reference parabola.
Please understand that x^2 means x2.
We will take a look at a y-coordinate calculation for the transformed parabola. Let's assume that the reference parabola is reflected across the x-axis and scaled vertically by a factor of 4, so a = -4. We will translate, or shift, the parabola left 3 units and down 2 units, so h = -3 and k = -2. Here's the calculation at x = 5:
y = a(x - h)2 + k
y = a(5 - h)2 + k
y = -4(5 - (-3))2 + (-2)
y = -4(5 + 3)2 - 2
y = -4(82) - 2
y = (-4)(64) - 2
y = -256 - 2
y = -258
Using the above transform ( a = -4, h = -3, and k = -2 ), consider the following question. If a point on the reference parabola is (5, 25), then what are the x- and y-coordinates on the corresponding point on the transformed parabola?
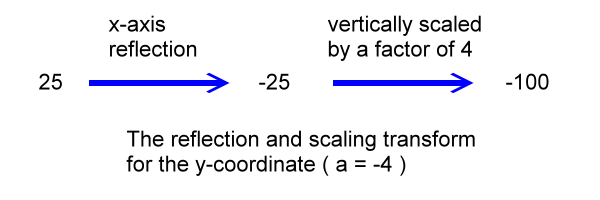
About the transformed y-coordinate: Let's see, at the reference point (5, 25) the y-coordinate is y = 25. Since a = -4, this y-coordinate is reflected across the x-axis transforming it to -25. Also, since a = -4, this y-coordinate is vertically scaled by a factor of 4, so, the value of -25 is multiplied by 4 to get a transformed y-coordinate of -100. We're not done with this y-coordinate, but here are the changes due to a that we just described:
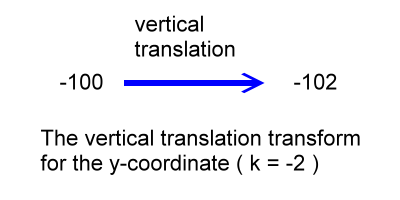
We still have the value of k to use for the calculation of the transformed y-coordinate. The value of k will move the y-coordinate up or down. Since k = -2, the y-coordinate is dropped 2 units, and it ends up resting at its transformed position of -102:
Basically, we have multiplied the reference y-coordinate by a ( a = -4 ) and then added k ( k = -2 ) to get the transformed y-coordinate:
ytransformed = (a)(yreference) + k
ytransformed = (-4)(25) + (-2)
ytransformed = (-100) + (-2)
ytransformed = -102
About the transformed x-coordinate: Along the x-axis we have no reflection or scaling, but we do have a translation to the left of 3 units ( h = -3 ). Our original reference x-coordinate at point (5, 25) is x = 5. We apply our horizontal translation to the left of 3 units by subtracting 3 from 5 and get 2. So, the corresponding x-coordinate on the transformed parabola is 2.
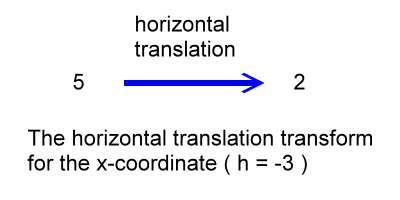
To get the transformed x-coordinate in this case we simply add h to the reference x-coordinate:
xtransformed = xreference + h
xtransformed = (5) + (-3)
xtransformed = 2
We can say now that point (5, 25) on the reference parabola is reflected, scaled and translated to arrive at point (2, -102) on the transformed parabola. All other points on the reference parabola would be transformed in a similar manner.
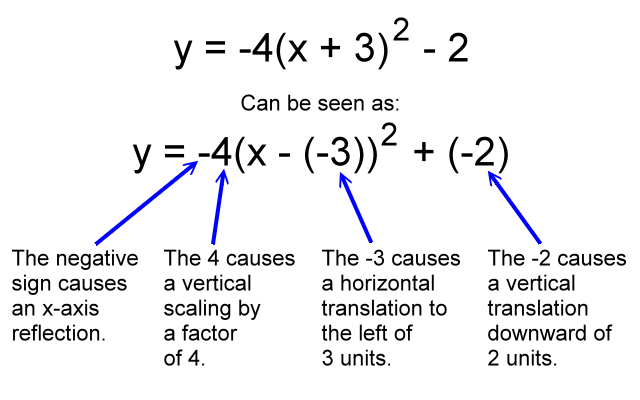
Reflect and scale first, then translate. In the above discussion we imagined a point on the reference parabola (5, 25) being moved to a corresponding point on the transformed parabola (2, -102). Take note of the order that we went through doing this transform logic.
You can do the y-thinking first, or you can do the x-thinking first. The x- and y-thinking operate independently.
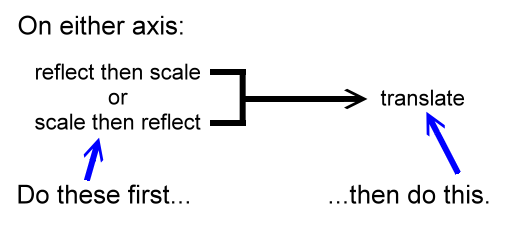
We'll considered the y-coordinate first. Note that we thought about vertical reflection and vertical scaling before we considered vertical translations. You should work this way in your thinking. Reflect and scale before you translate. The correct order is:
- Reflect and scale
- Translate
When you reflect and scale, you can reflect first and then scale, or scale first and then reflect. You'll get to the same value. Just be sure to get done with your reflecting and scaling thinking before you go further with the translation.
And although this current discussion is about a y-coordinate, the same could be said about the x-coordinate. No matter which axis you are working with, reflect and scale first and then translate.
Now, let's look at the x-coordinate. In our parabola discussion the x-coordinate was not examined regarding y-axis reflections and horizontal scalings. It was only horizontally translated. So, calculations regarding reflections and scaling do not come up. If things were different, and they did, then we would reflect and scale first before translating along this x-axis.
We are only translating here, its the only thing to do.
The reasons why we do not consider y-axis reflections and horizontal scaling for the parabola will be covered in detail in another part of this Function Transforms section. Basically, for the moment, the parabola is symmetrical about the y-axis, so reflecting it over the y-axis does not really make an new shape.
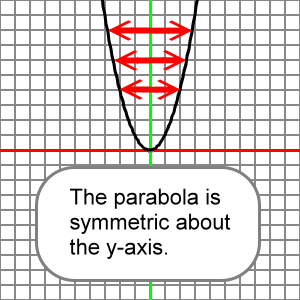
Also, the parabola is a shape where a vertical stretch can yield the same shape as a horizontal compression. In other words for every horizontal scaling there is an equivalent vertical scaling that leads to the same transformed shape. So, all parabola scaling transforms can be imagined using only vertical thinking, as we have done here.
Again, we could have figured out that x = 2 on the transformed parabola before we found that y = -102. You can do the x- and y-thinking independently and do either one first when transforming function shapes.
Here is an EZ Graph example of these scalings and translations:
You can change the value for a, h, or k using the upper left input boxes. Press the 'Draw graph' button after you change a, h, or k and you will see how your change effects the graph. For more information about EZ Graph click the following link: