Parabola, Vertical Scaling
Vertical scaling for the parabola is changed by the coefficient of x2. The variable a is often used for this coefficient. So, to begin, our starting or reference parabola formula looks like this:
y = x2
Since a is the coefficient of x2, our equation that includes vertical scaling looks like this:
y = ax2
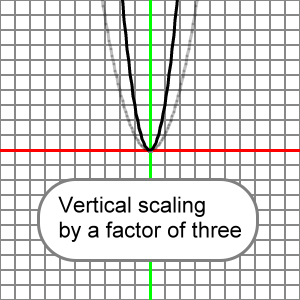
So, if a = 3, we say that the reference parabola is scaled vertically by a factor of 3, and our equation for this would appear:
y = 3x2
Here's the graph for this scaling. The reference parabola ( y = x2 ) is drawn in transparent light gray, and the transformed parabola which is vertically scaled by a factor of 3 ( y = 3x2 ) is drawn in black:
What follows is an animation that presents many vertical scalings for our reference parabola. Note that the value for a is shown within parentheses before x2. Watch for what happens to the parabola when a changes between positive and negative values. When a = 0, all y-values for the function will be 0. When a = 1, the reference and transformed parabola are the same.
Please understand that x^2 means x2.
Let's cover some notation. First a bit about parentheses. This:
(3)x2
Is the same as:
3x2
And this:
(-3)x2
Is the same as:
-3x2
Now, what about when a = 1 or -1? Note that this:
y = (1)x2
Is simply:
y = x2
And note that:
y = (-1)x2
Is:
y = -x2
In all of the cases shown above understand that the calculation for y proceeds this way:
- First, get the value for x and square it.
- Second, multiply the value for x2 by a, the vertical scaling factor.
So, if x = 4 and a = -2, then:
y = ax2
y = -2x2
y = (-2)(42)
y = (-2)(16)
y = -32
Don't do any thinking like the following. Do not multiply a times x and then square:
y = ax2
y = -2x2
y = (-2)(4)2
y = ((-2)(4))2
y = (-8)2
y = 64 (Not correct.)
Square x first, and then multiply by a.
And note that if, say, x = 3 and a = -1, then:
y = ax2
y = (-1)(32) = -32
y = -(32)
y = -9
About reflections: Let's for the moment consider two cases. We will let a = 1 and a = -1.
Now, let x = 2, and our calculation for y when a = 1 looks like this:
y = ax2 = (1)(22) = 4
Here's the calculation when a = -1:
y = ax2 = (-1)(22) = -4
Here's what this all looks like:
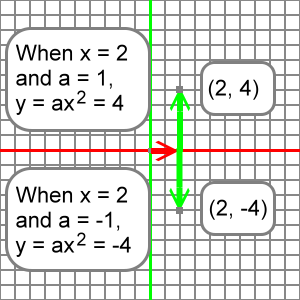
Notice that the first point, created when x = 2 and a = 1, is 4 units above the x-axis; it's y-coordinate is 4.
The second point, created when x = 2 and a = -1, is 4 units below the x-axis; it's y-coordinate is -4.
The first point is just as far above the x-axis as the second point is below it. We say the the second point is the reflection of the first point across the x-axis.
A similar reflection across the x-axis would occur for any x-coordinate. For example, if x = 3, then y = 9 and y = -9 are the function values when a changes from 1 to -1 respectively, as shown here:
| a = 1 y = ax2 y = (1)(32) y = 9 |
a = -1 y = ax2 y = (-1)(32) y = -9 |
Below we will see a graph showing how this all looks when full parabolas are drawn. Realize that when a = 1 we have our reference parabola:
y = (1)x2 = x2
When a = -1, we have:
y = (-1)x2 = -x2
When a = -1, all the points on the reference parabola have been reflected over the x-axis. The graph below has the reference parabola drawn in transparent light gray, and it's reflection across the x-axis drawn in black. Several points on the reference parabola have been noted along with their corresponding points on the reflected parabola:
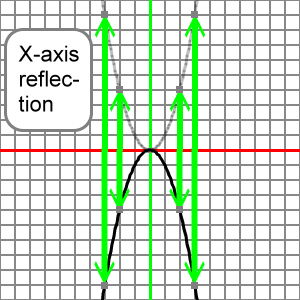
Understand that the sign of a (positive or negative) controls the reflection of the reference parabola as we think about our transform. We can imagine that changing the value of a from 1 to -1 reflects the reference parabola over the x-axis. This reflection of the reference parabola correctly represents the graph of the transformed parabola.
So, if we know the graph of y = x2, we can understand that the graph of y = -x2 is its x-axis reflection.
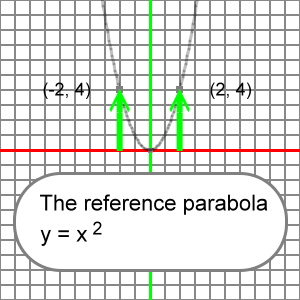
Now, let's explain the term 'vertical scaling factor'. For a short time set aside the idea of reflection across the x-axis and work only with positive values of a. Imagine our reference parabola:
If we say that it will be vertically scaled by a factor of 2, what we mean is that every point on the reference parabola has been moved up twice as high (factor of 2) from the x-axis to become the transformed parabola. So, if we have our reference parabola:
y = x2
And we locate at x = 3, then y = 9:
y = x2 = 32 = 9
And our transformed parabola, vertically scaled by a factor of 2, is:
y = 2x2
And we again let x = 3, then y = 18:
y = 2x2 = (2)(32) = (2)(9) = 18
Notice that at the same x-coordinate, x = 3, the y-coordinate is twice as high, 18 = (2)(9).
So, we say that we have vertically scaled the reference parabola by a factor of 2 in order to create the transformed parabola.
Below are the two parabolas. The reference parabola is colored transparent light gray. The transformed parabola, vertically scaled by a factor of 2, is in black.
Notice that for corresponding x-coordinates, the y-coordinates on the transformed parabola are twice as high above the x-axis as those corresponding y-coordinates on the reference parabola. The above numerical calculation does not fit on the graphs, since y-coordinates on the graphs only extend to 10. However, you can easily see another couple of similar examples at x-coordinates -2 and 2:
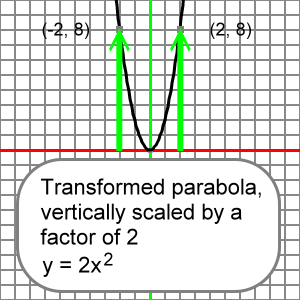
In the above graphs note how the reference parabola's y-coordinates are doubled when it is transformed by a vertical scaling factor of 2.
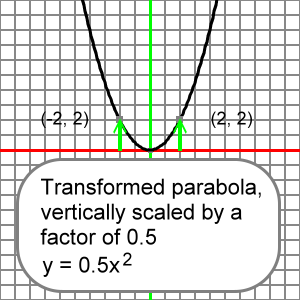
If the vertically scaling factor is less than 1, then the y-coordinates on the transformed parabola are less than the corresponding y-coordinates on the reference parabola. The transformed parabola is a squashed version of the reference parabola in this case.
Specifically, at x = 3, the reference y-coordinate is 9:
y = x2 = 32 = 9
Let's let a = 0.5, and we see that at x = 3 on the transformed parabola y = 4.5:
y = 0.5x2 = (0.5)(32) = (0.5)(9) = 4.5
This transformed y-coordinate is exactly half (0.5) the value of the reference y-coordinate:
(0.5)(9) = 4.5
Here's the reference and transformed parabolas (colored as before) showing other examples of halving of the y-coordinates at the x-locations used on graphs earlier:
So, the vertical scaling factor controls the stretching or the compressing of the y-coordinates of the reference parabola. After this stretching or compressing of the reference parabola, we are left with a graph of the transformed, vertically scaled parabola.
Let's put x-axis reflections and vertical scalings together. They are both controled by the value of a, the coefficient of x2. We will examine the value of a and imagine how this value changes the shape of the reference parabola into the shape of the transformed, vertically reflected and scaled parabola. It works this way:
- If a is positive (a > 0), then the reference parabola is not reflected over the x-axis. You might say the transformed parabola 'opens up'.
- if a is negative (a < 0), then the reference parabola is reflected across the x-axis. It 'opens down'.
- The reference parabola is stretched or compressed by the
size, or absolute value, of
a.
- If the absolute value of a is greater than 1, the reference parabola is vertically stretched. All of the referenced y-coordinates become greater due to multiplication by a number greater than 1.
- If the absolute value of a is less than 1, the reference parabola is vertically compressed. All of the referenced y-coordinates become less due to the multiplication by a number less than 1.
It really doesn't matter if you imagine the possible x-axis reflection first and then the vertical scaling, or if you imagine the scaling and then the possible reflection.
However, as we shall see later in this section about function transforms, often the order in which you view the features of the transform can be important, especially when translations (right, left, up, or down movements) are present.
If a = -4, then we would have:
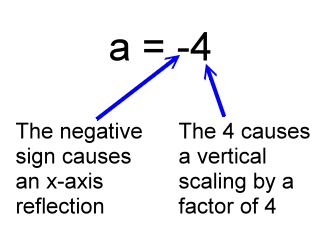
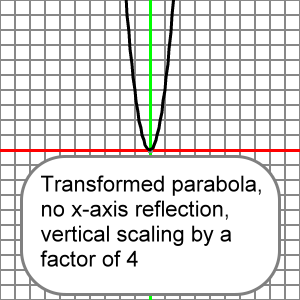
So, a graph of this function:
y = 4x2
Would look like the reference parabola after it did not reflect across the x-axis, and after all of the y-coordinates of the reference parabola were multiplied by 4.

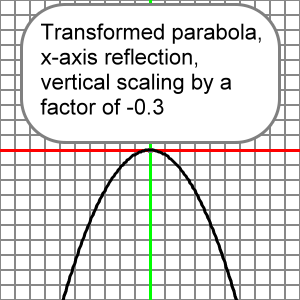
And a graph of this function:
y = -0.3x2
Would look like the reference parabola after all of its y-coordinates were multiplied by 0.3 and then reflected across the x-axis.
Here is an EZ Graph example of this vertical scaling. Press the 'Draw graph' button.
You can change the value for a using the upper left input boxes. Press the 'Draw graph' button after you change a, and you will see how your change effects the graph. For more information about EZ Graph click the following link: