XVA Help
XVA is a program that plots motion graphs for a visible moving object. It draws three graphs:
- The position verses time, or x vs. t, graph
- The velocity verses time, of v vs. t, graph
- The acceleration verses time, or a vs. t, graph
Here's some quick tips about XVA. More pictures and instructions follow, and then some more final information.
- The motion is along a straight line.
- The motion has a constant acceleration.
- The motion lasts for ten time units.
- You can set the original, or starting, position.
- You can set the original velocity.
- You can set the constant acceleration.
- You can set the object at its starting point.
- You can start, pause, and resume the motion.
- You can run the motion slowly.
- You can clear the graphs.
The object that moves:
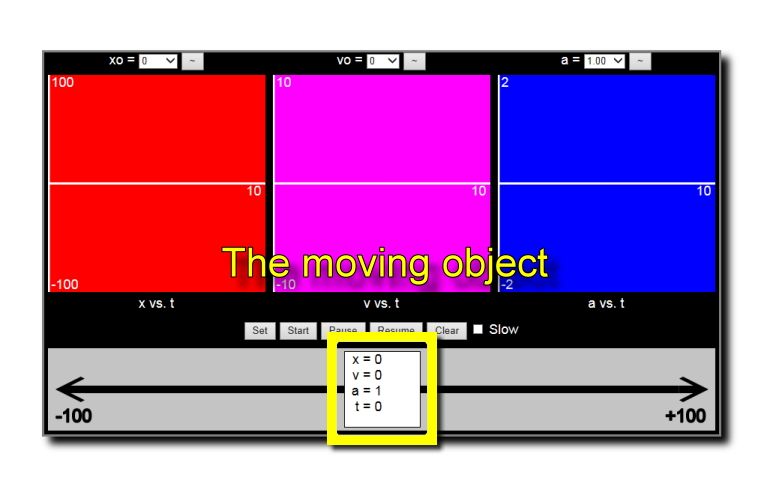
The object that moves is the white box at the bottom of the program's display. It moves to the left and right along it's position number line, or x-axis.
The current position (x), velocity (v), acceleration (a), and time (t) for the object are displayed within the object's box.
The three graphs plot the motion of this object.
The object moves along this line:
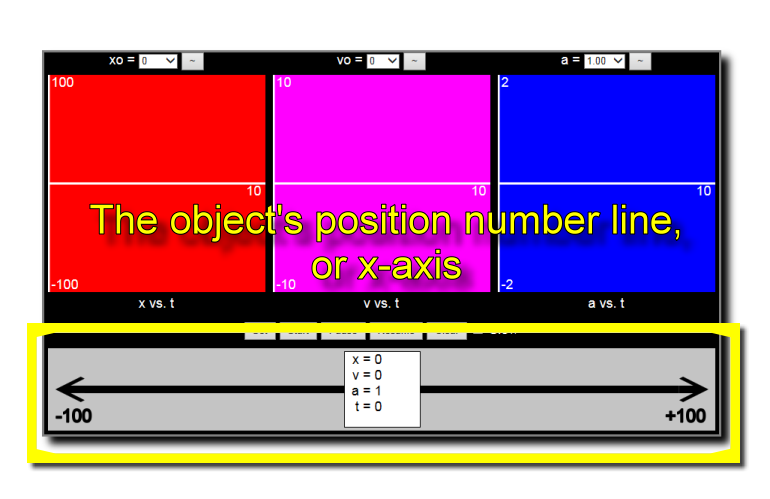
The position axis, or x-axis, is the path along which the object moves. Within the program's display it runs from -100 to +100 position units.
Sometimes the object's motion will exceed the bounds of this axis, and the object will disappear to the left or right.
The position verses time graph:
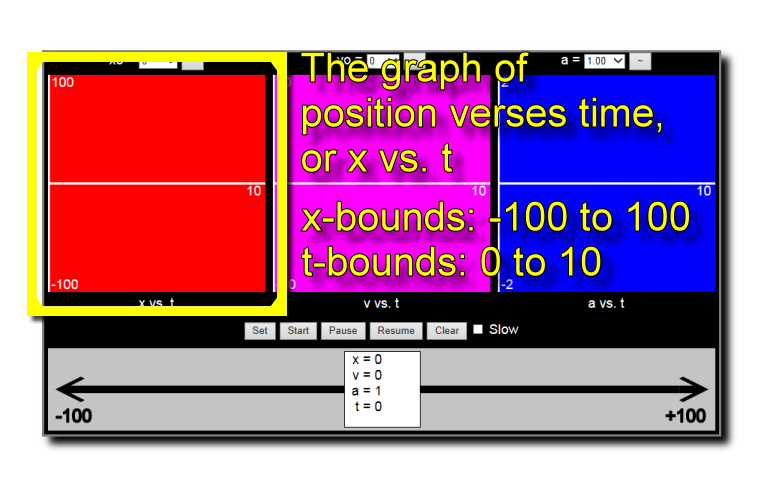
The position verses time graph is often called the x vs. t graph. It shows where the object is located at every time unit during its motion.
The position of the object, or x, is plotted vertically as the dependent variable. Time is plotted horizontally as the independent variable.
Positive positions on this graph proceed upward, negative positions downward. On the position number line at the bottom of the program positive positions proceed to the right, negative positions to the left.
The velocity verses time graph:
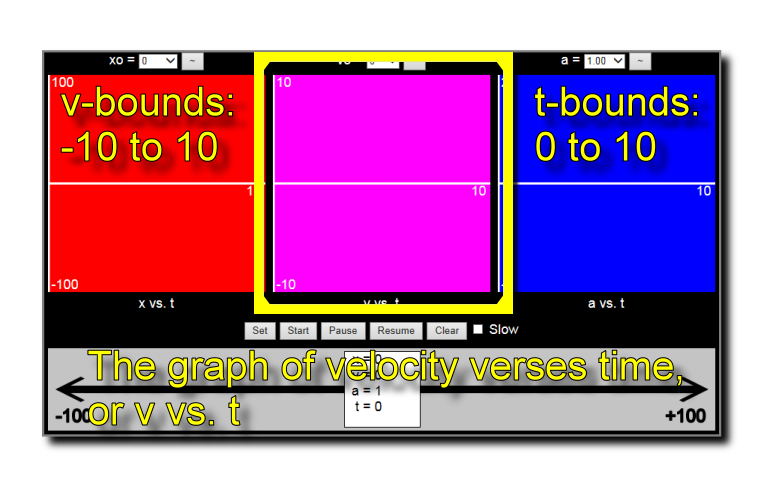
The velocity verses time graph is often called the v vs. t graph. It shows the velocity of the object at every time unit of the motion.
The velocity of the object, or v, is plotted vertically as the dependent variable. Time is plotted horizontally as the independent variable.
Positive velocities on this graph proceed upward, negative velocities downward. On the position number line at the bottom of the program the object moves to the right when it has a positive velocity, and it moves to the left when it has a negative velocity.
The acceleration verses time graph:
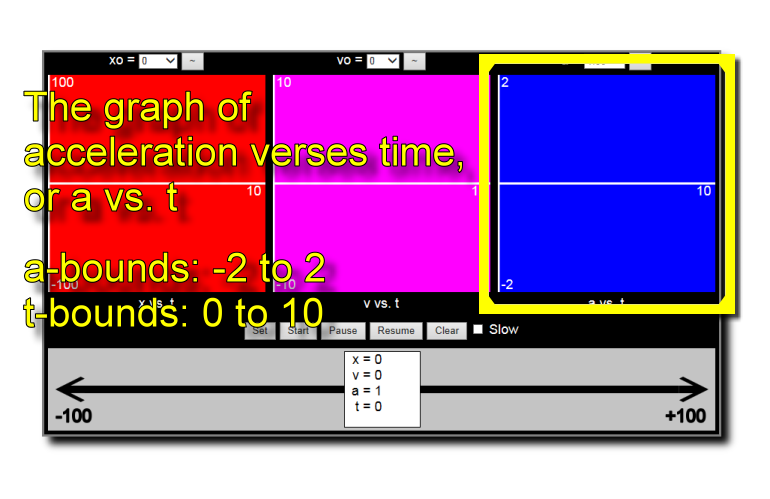
The acceleration verses time graph is often called the a vs. t graph. It shows the acceleration of the object at every time unit of the motion.
The acceleration of the object, or a, is plotted vertically as the dependent variable. Time is plotted horizontally as the independent variable.
Positive accelerations on this graph proceed upward, negative accelerations downward.
The original position:
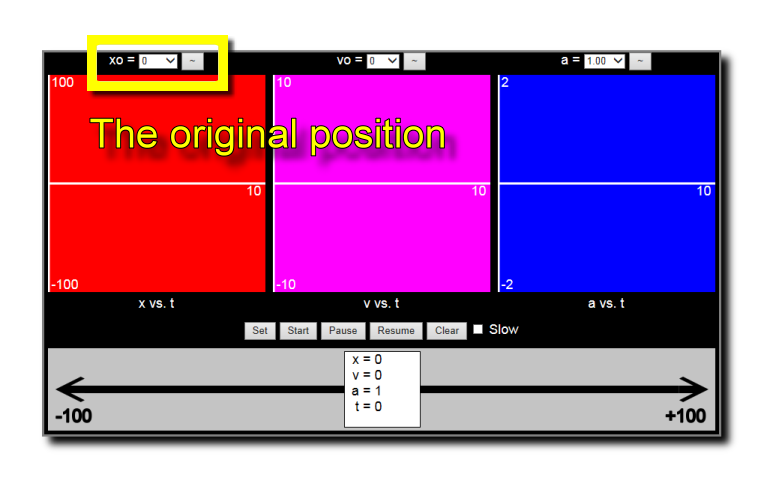
The original position, or xo, is the place where the motion of the object will begin. You can set the the original position using this control.
You can use the drop down list to select a starting position. If you press the button labeled '~' to the right of this drop down list, the drop down list will change to an input text box, and you can type in any starting position that you want. Clicking the '~' button again will bring back the drop down list.
The original velocity:
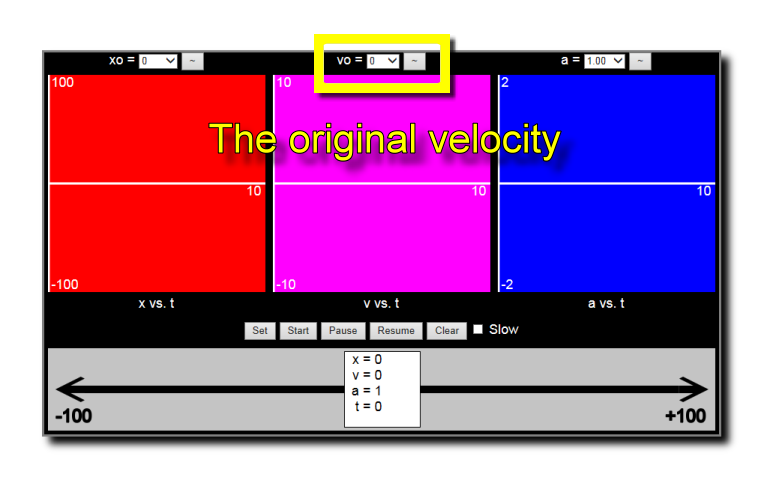
The original velocity, or vo, is the starting velocity for the motion of the object. This control lets you set the starting velocity for the object's motion.
The original velocity's drop down list and '~' button work the same as those for the original position.
The constant acceleration:
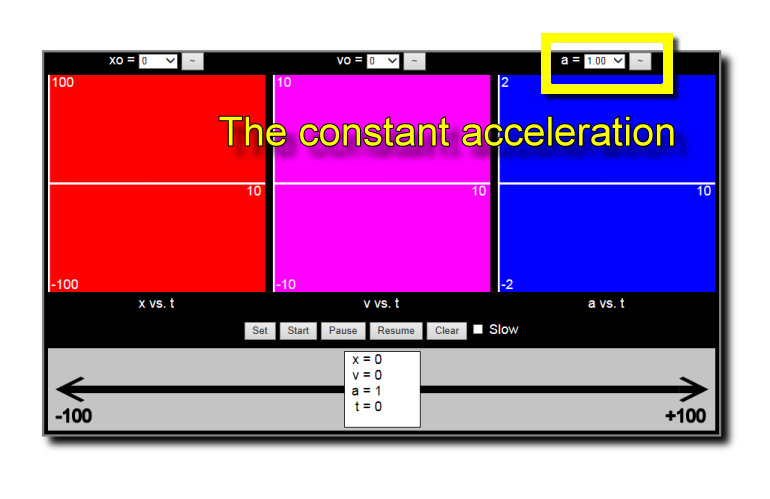
The constant acceleration, or a, is the acceleration that the object experiences throughout it's motion. You set the constant acceleration with this control. This control works like the one for original position.
This constant acceleration is not just a starting value; it is a continuous, non-changing value, during the motion of the object.
The controls:
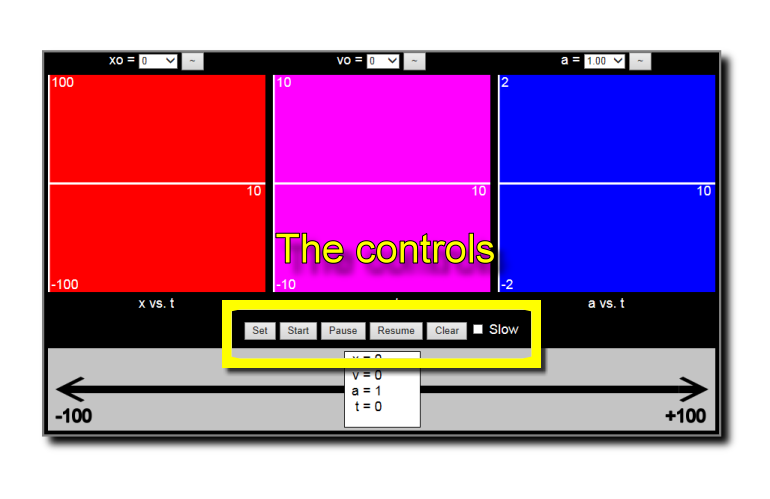
These are the main controls for the XVA program. Here's what they do:
- Set: Places the object at its starting position. All the motion variables displayed within the object will be set to their original or constant values.
- Start: Begins the motion. The object will start moving and the current values for the motion variables will be updated as the object moves. The three graphs will be drawn during the motion of the object.
- Pause: Temporarily stops the motion of the object. This is useful if you want to check the motion variables' values at a certain point.
- Resume: Starts the motion again after a pause.
- Clear: Erases all three graphs.
- Slow: Check this box to see the motion proceed slowly. This is very useful for carefully studying the motion of the object.
Clicking the 'Start' button will not clear the graphs. This allows you to compare different motions. You can, for example, set up an accelerated motion, graph it, and then change xo, vo, or a. You can start the motion again, and the new graphs will be drawn with the old graphs still visible. This lets you easily study changes in the graphs. Use the 'Clear' button to set up a fresh start.
