Graph Paper - X, Y Scaling
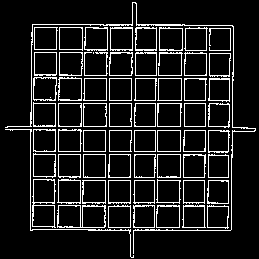
Usually graph paper is marked off with lines that are spaced equally along the x and y axes. In this case the x- and y-axes are scaled identically. One unit of physical distance along the x-axis is equal in length to one unit of physical distance along the y-axis. This arrangement forms a grid of squares.
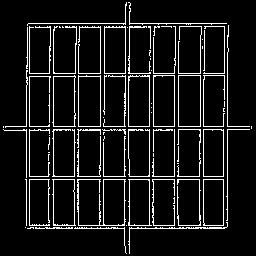
However, it is important to understand that the two axes can be scaled differently. For example, 1 centimeter might separate the coordinates x = 0 and x = 1 along the x-axis, while 2 centimeters might separate the the coordinates y = 0 and y = 1 along the y-axis. This arrangement forms of grid of rectangles that are twice as tall as they are wide. One could think of the graph paper stretching in the y-direction.
In the following demonstration you can change the scaling of the graph paper both in the x and the y directions. Be sure to watch the four graph bound outputs as you click the scale buttons. Notice how changing the scaling for the graph paper apparently changes the shapes of the functions that are drawn on the graph paper.
Understand that we are not changing the (x, y) point values for the funciton. We are not transforming the function. We are changing the x- and y-scales for a square piece of graph paper. This apparently changes the shape of the graph, but that is only because the x- and y-axes are not necessarily scaled the same. This is all quite a bit like thinking of the graph paper as a rubber sheet that can be stretched and compressed vertically or horizontally.
Material regarding function transformations can be found here: Function Transformations