Function Transformations
Function transformations are math operations that cause the shape of a function's graph to change. We will be discussing how these function shapes are related to equations, and how changes in those equations effect the shape of the functions.

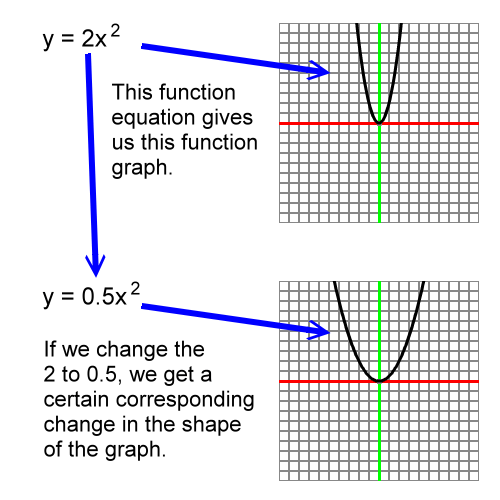
For example, both of the following functions are parabolas, but by changing the coefficient of x2 we change the shape of the parabola's graph:

We are going to work with the shapes of functions as they are drawn on graph paper. We will use words like stretch, compress, and move to describe the function's shape change.
It's important to understand that we are not talking about changing the graph paper. We are not stretching, compressing, or moving the graph paper. That's a different, although related, topic. You can find material on scaling graph paper here: Graph Paper - X, Y Scaling
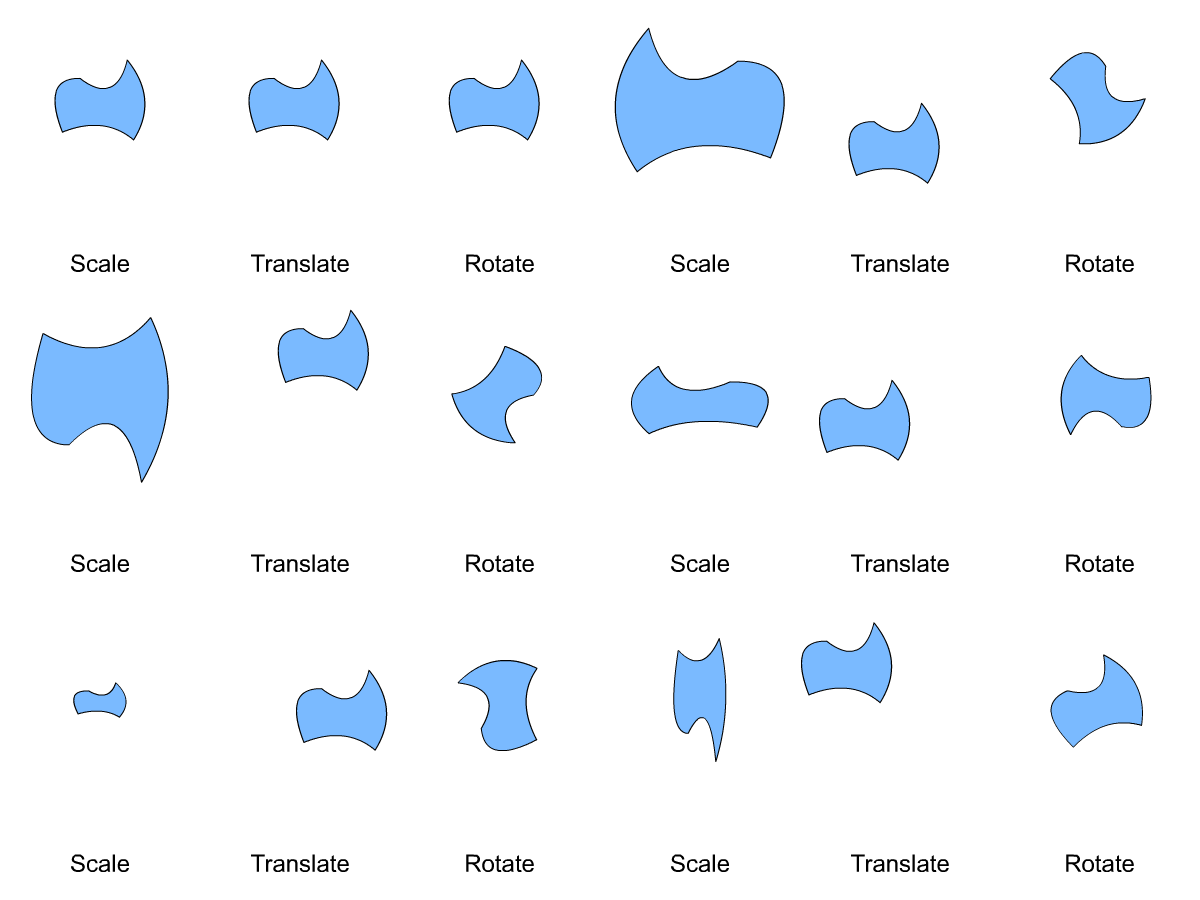
The general term for describing a function's shape change is 'transform'. The three types of transforms are...
- Scale
- A scaling is the stretching or compressing of a shape.
- Translate
- A translation is the moving of a shape without distorting it.
- Rotate
- A rotation is the spinning of a shape about a point.

Our list of transform types could also include a change in shape called a reflection. In this discussion we will cover reflections in the scaling section. If you watch the Scale section of the above animation you will notice that now and then the shape flips right or left, or up or down. These are actually reflections. Scalings and reflections both are governed by the same coefficient value within a function's equation, so we'll cover them together.
We will not be covering rotations here. So, the transforms that we'll take a look at are scalings (including reflections) and translations.
At first, let's work with some terms that are used to describe shape changes. We will begin with these terms:
- Vertical scaling
- Horizontal scaling
- Vertical translation
- Horizontal translation
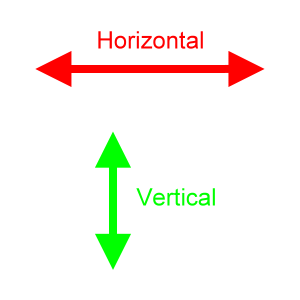
Be sure to clearly understand what 'vertical' and 'horizontal' mean:

The word horizontal refers to an alignment or axis that extends to the left and to the right. The word vertical refers to an alignment or axis that extends up and down.
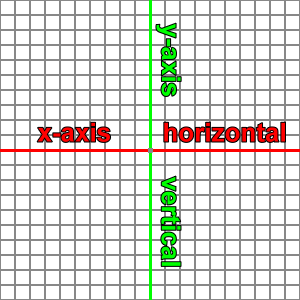
On a typical (x, y) graph, the x-axis is horizontal, and the y-axis is vertical:

Vertical scaling refers to a stretching of a shape along a vertical direction.

The vertical size of the shape...
- gets larger or smaller.
- grows or shrinks in both the upward and downward directions equally.
- grows or shrinks from the vertical center of the shape.
The horizontal size of the shape does not change.
Here is a simple polynomial function, a cubic, being presented with several different vertical scaling:

As the above animation cycles, you can imagine that the function's shape is being stretched vertically. The shape is stretched upward above the x-axis, and the shape is stretched downward below the x-axis.
However, you may imagine that the function is being compressed horizontally toward the center of the graph. This would be considered a horizontal scaling, as we will see in a later section. As it turns out, some vertical scalings are equivalent to horizontal scalings for certain types of functions, and this cubic is one such case.
So, the following animation is meant to help insure that you are imagining a vertical scaling and not a horizontal one:

Note the little gray markers in the above animation. The ones on the x-axis do not move; however, their corresponding y-axis markers are stretched further and further apart upward or downward. Many of the y-axis markers are stretched far enough to be past the edge of the graph paper.
Horizontal scaling refers to the stretching of a shape along a horizontal direction.

The horizontal size of this shape...
- gets larger or smaller.
- grows or shrinks in both the leftward and rightward directions equally.
- grows or shrinks from the horizontal carter of the shape.
The vertical size of the shape does not change.
Here is a trigonometric function, a sine curve, that is shown at several horizontal scalings:

Vertical translation refers to a movement of a shape upward or downward.

The vertical position of the shape...
- moves upward or downward.
The horizontal position of the shape does not change.
The vertical and horizontal size of the shape do not change.
Here is a simple rational function, y = 1/x, that is shown with several vertical translations:

Horizontal translation refers to the movement of a shape to the left or to the right.

The horizontal position of the shape...
- moves leftward or rightward.
The vertical position of the shape does not change.
The vertical and horizontal size of the shape do not change.
Here is a parabola, y = x2, undergoing several horizontal translations:

Since we often work on an (x, y) graph, and since the x-axis is usually represented horizontally, horizontal scaling and horizontal translations will also be called x-scaling and x-translations. The same goes for the y-axis in the vertical direction. Vertical scaling and vertical translation can also be termed y-scaling and y-translations.
Now, how are these transforms represented as elements within the equations that describe functions? Or, to turn the idea around, how do changes in the terms and factors of a function's equation effect the shape of its graph? It's probably best at this point to work with a certain function and to describe our transforms along with it. Let's start with a simple second degree polynomial, the parabola: