Intersection of Line and Parabola

Here we will cover a method for finding the point or points of intersection for a linear function and a quadratic function. Quadratic functions graph as parabolas. So, we will find the (x, y) coordinate pairs where a line crosses a parabola.
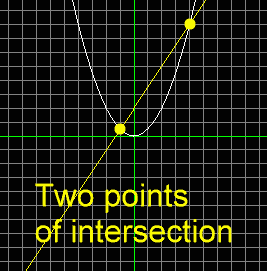
First, understand that a line and a parabola may intersect at two points, as in this picture:
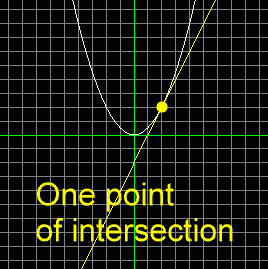
Or, they may intersect at only one point, as in this picture:
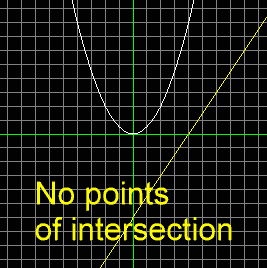
Or, they may not meet at any points, as shown here:
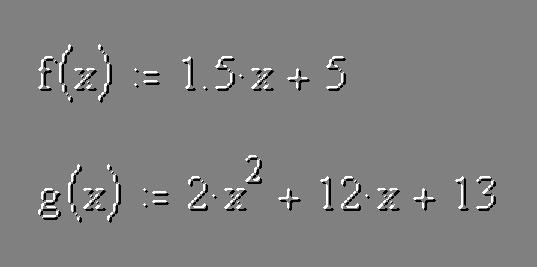
For this example we will use these two functions:
f(x) = 1.5x + 5
g(x) = 2x2 + 12x + 13
The first one, f(x), is a line, and the second, g(x), is a parabola. Since we will be graphing these functions on the x, y coordinate axes, we can express them this way:
y = 1.5x + 5
y = 2x2 + 12x + 13
When graphed, these two functions look like this:
Now, the places where the two functions cross are called their points of intersection. At these points of intersection the x-coordinate for the line equals the x-coordinate for the parabola, and the y-coordinate for the line equals the y-coordinate for the parabola.
Since at the points of intersection the y-coordinates are equal, (we'll get to the x-coordinates in a moment), let's set the y-coordinate from line equal to the y-coordinate from parabola.
The y-coordinate for the line is calculated this way:
y = 1.5x + 5
The y-coordinate for the parabola is calculated this way:
y = 2x2 + 12x + 13
Setting the two y-coordinates equal looks like this:
1.5x + 5 = 2x2 + 12x + 13
When we solve the above equation, we find the x-coordinates for the points of intersection. Here's the algebra:
We start here. Subtract 1.5x from each side. Subtract 5 from each side. Use the quadratic formula to solve for x. Here are are two solutions for x.
Now, we will plug each value for the x-coordinate into either of the intersecting functions to get its corresponding y-coordinate. Let's first work with x = -0.92. We will plug this into the equation of the line to get the y-coordinate. Here is that work:
y = 1.5x + 5
y = 1.5(-0.92) + 5
y = -1.38 + 5
y = 3.62
Notice that if we would have chosen to have worked with the quadratic function, we would have gotten the same y-coordinate. (We are off just a bit due to rounding and truncating decimals along the way, both above in the evaluation of the quadratic formula and below where we keep intermediate results to two decimals.):
y = 2x2 + 12x + 13
y = 2(-0.92)2 + 12(-0.92) + 13
y = 1.69 - 11.04 + 13
y = 3.65
So, to a fair degree of accuracy, the two functions intersect at (-0.92, 3.62). Let's find the other point of intersection. We know that the x-coordinate is -4.33, and using the equation for the line we can find the y-coordinate:
y = 1.5x + 5
y = 1.5(-4.33) + 5
y = -6.49 + 5
y = -1.49
Therefore, the two functions also intersect at (-4.33, -1.49). Here's how those spots look on the graph:
You can use the above procedure can be used to find the intersection of any line with any parabola. Of course, the line and parabola will not always intersect at two points. Sometimes they will only intersect at one point, and quite often they will not intersect at all. These conditions will show up when you solve the quadratic equation after you set the two separate functions equal to each other and collect like terms. When solving that quadratic equation, if the discriminant equals zero, then you will have only one solution for x, which boils down to only one point of intersection. If the discriminant is negative, then there are no solutions for x, which means the line and parabola do not intersect.
Want to try this yourself? Below is a calculator which you can use to check your work. First, make up two functions, one for a line and one for a parabola. You could use the function graphers in the Function Institute to help you find the values for the first degree polynomial, (linear function for the line), and the second degree polynomial, (quadratic function for the parabola), or you could just make them up. Perhaps you would choose the line and parabola functions discussed above:
y = 1.5x + 5 (for the line)
y = 2x2 + 12x + 13 (for the parabola)
If you wanted to see these functions using EZ Graph you would type each into one of the 'y =' boxes at the bottom of the grapher like this:
1.5*x + 5
2*x^2 + 12*x + 13
(Don't forget to check the 'Use' box for each before clicking the 'Draw' button.)
So, get yourself two functions, use the method above to find their intersections, and then put the appropriate values into the calculator below, click 'Calculate Intersection' and check your work.


