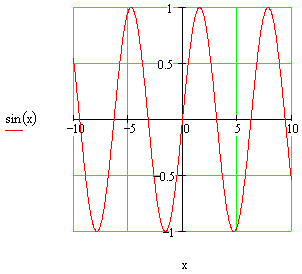
The Graph of the Sine Function

To the left is the graph of the sine function.
Click the EZ Graph link below to examine this graph with a graphic calculator, explanations included. Links for other examples of the sine function graph along with their explanations follow below.
More graphs of the sine function using EZ Graph:
Angle in degrees:
-360° to 360° with amplitude variable
-360° to 360° with horizontal translation (or phase shift) variable
-360° to 360° with vertical translation variable
-360° to 360° with amplitude and translation variables
Angle in radians:
-2Pi to 2Pi with amplitude and translation variables
