Slope of the x vs. t Graph, Velocity
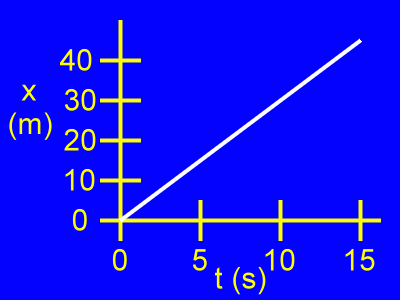
Here is an x vs. t, or position vs. time, graph.
Position (x) is vertical.
Time (t) is horizontal.
Initially, when t = 0 s, the object is at x = 0 m.
From then on as time passes the object moves away from the origin of the position (x) number line.
Let's look at two points on this graph....
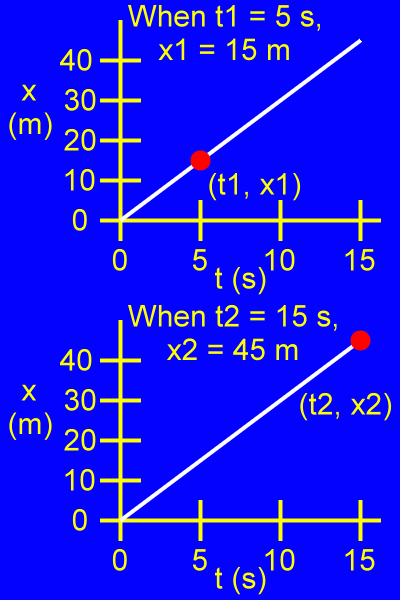
Examine the first point, (t1, x1).
When t1 = 5 s, then x1 = 15 m.
Examine the second point, (t2, x2).
When t2 = 15 s, then x2 = 45 m.
Let's find the slope of this graph using those two points...
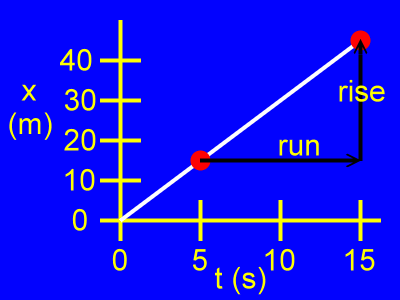
Using those two points, here is the rise and the run of the slope of this x vs. t graph.
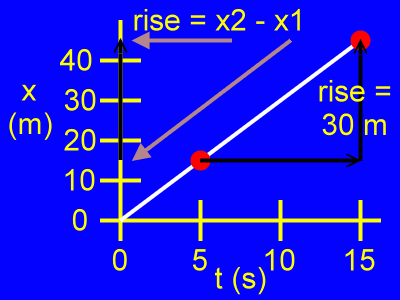
Here, the rise is the difference of the position coordinates, or x2 - x1, as in:
rise = x2 - x1
rise = 45 m - 15 m
rise = 30 m
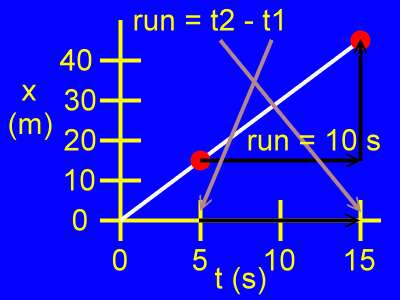
Here, the run is the difference of the time coordinates, or t2 - t1, as in:
run = t2 - t1
run = 15 s - 5 s
run = 10 s
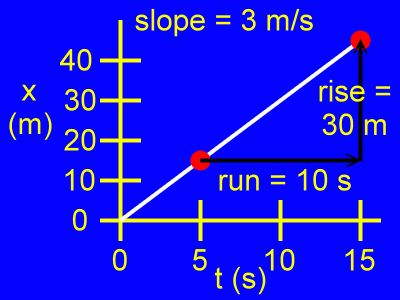
The slope of this graph is a change in position divided by a change in time, as in:
slope = rise / run
slope = 30 m / 10 s
slope = 3 m/s
This slope is the velocity of the object, since velocity is defined as the change in position divided by the change in time. So....
Velocity = 3 m/s.