Position vs. Time, or x vs. t

Click the 'Start clock' button and drag the little fellow riding the bike. (Tablet or phone users should repeatedly tap their surface slightly before or after Bike Guy.) A position vs. time graph of your motion will be drawn. To make another graph, stop the clock, then start it again.
It will take a bit to completely explain the above demo. Those explanations follow. First we will learn what a position vs. time graph is, then we will learn more about the above demo.
Here we are considering one dimensional motion. An object is undergoing one dimensional motion when it moves along a straight line. The object does not turn around a corner; it does not follow a curved path. It can go forward or backward or stand still. This straight line is considered to be a number line like those seen in algebra.

So, if an object moves along this number line, then at every moment of time it is positioned at a certain coordinate. A certain time matches with a certain position of the object.
|
|
|
It is common to use the variable x to hold the value for the position coordinate. The object's position is the value of x. So, the position number line is the x number line. This number line is called the position axis, or usually the x-axis.
We will use the variable t to hold the value for the time coordinate. Time, too, can be thought to be marked along the coordinates of a number line. This is called the time-axis, or t-axis. It usually starts at zero and continues out toward increasing positive numbers. We usually do not consider negative coordinates for time.
Again, for every moment of time as an object moves down the x-axis, that object is at a certain x-coordinate at a certain time. So, a certain position matches up with a certain time. For example, suppose we start our thinking with the object at the origin of the x-axis, or x = 0. We will now 'start the clock'; we will start to consider time as ticking away, say, as a number of seconds. Like when using a common stop watch, at the very start we have zero seconds, or t = 0. So, we have a coordinate for the object's time, t = 0, and we have a matching coordinate for the object's position, x = 0.
Later, say after two time units (usually seconds), when t = 2, imagine that we find the object moving over the position coordinate at x = 6 (often meters). Now we have another pair of matching coordinates. When t = 2, x = 6.
Yet a bit later, imagine that when t = 3, the object is moving over x = 9. We could summarize all these pairs of matching time and position coordinates with a table that looks like this:
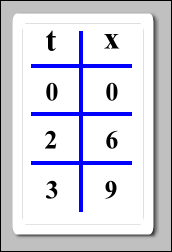
An x vs. t graph (position vs. time graph) is a picture of how these certain positions match up with the certain times. Using the above data table, the information looks like this on a position vs. time graph:
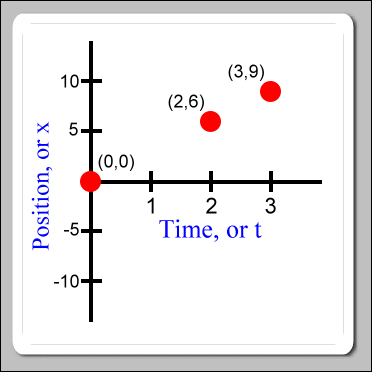
The time axis is horizontal, the position axis is vertical. At first, you may find it unusual to see something called an x-axis being drawn vertically. If this is so, it is probably because we are very used to seeing something called an x-axis in algebra discussions. In algebra we often work on an (x, y) coordinate graph where the x-axis is drawn horizontally. However, the x-axis in algebra is not this x-axis in physics, although they have similar sounding names.
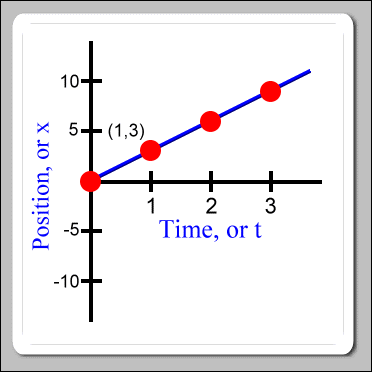
When the graph is drawn as we have, we say that the position of the object is a function of time. By that we mean that if we know what time it is, then we can use the graph to find out where the object is at. As it turns out, if the object is moving along with uniform speed, then the time and position coordinate pairs form a straight line through the points that we have already drawn. So, for example, we can now see that when time was equal to 1, position was equal to 3:
Now, what about running the above demo? Here is how to use it:
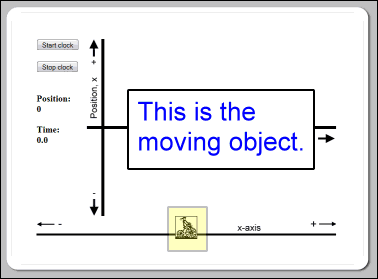
The little fellow on the bicycle, Bike Guy, is the object that moves. The demo makes a position vs. time graph of this object's motion.
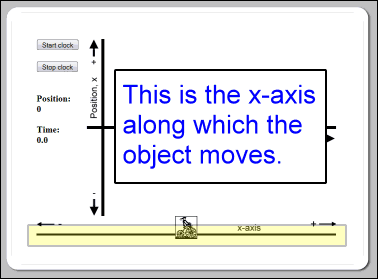
Imagine this x-axis to be the actual physical straight line path that the moving object travels along. The origin on this number line is at its middle. X-coordinates are positive to the right of the origin and negative to the left. When you first see the demo, Bike Guy is over the origin.
At first, before starting the clock, you can gently drag the moving object to the right or left along this number line. You would do this to experiment with setting up the starting position for the motion.
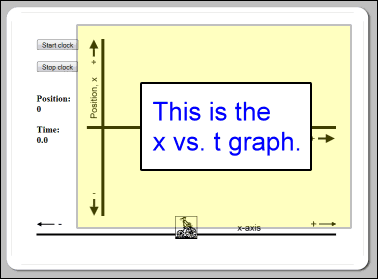
The motion of the moving object will be recorded on this x vs. t graph.
These buttons start and stop the clock. You can think of that as starting and stopping the demo. When you start the clock, time begins ticking away with the starting time being 0. Once the clock is started, the demo will begin to draw the x vs. t graph. The graph line is blue. While the clock is running, gently drag the moving object to the right or left, and you will see its motion recorded on the graph.
You can stop the demo at any time with the 'Stop clock' button. Restarting the demo with the 'Start clock' button will erase the graph and reset the starting time to 0. Restarting does not reset the object back to the origin. The demo automatically restarts when the time increases to 45 units.
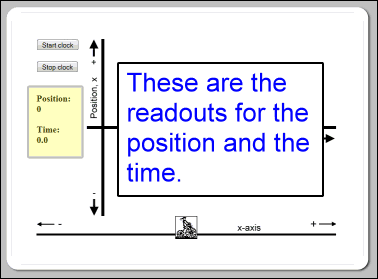
You can see the current position and time readouts at these positions. Both the position and time are measured in abstract units. The demo's clock does not count real seconds, nor does the demo measure position in, say, meters.
Now, to get things working, click the 'Start clock' button. Next, using your mouse gently drag the moving object, Bike Guy, to the right. (Tablet or phone users should repeatedly tap their surface directly to the right of Bike Guy. The moving object will hop to the point where you tap. Tapping just a bit in front of the object several times will make it move somewhat like it was being dragged by a mouse.) As the object moves to the right you should see the x vs. t graph being drawn slanted up with a positive slope. The faster you move, the steeper the slope. Moving the object to the left causes the graph to be drawn slanted down.
You can clear the graph and start again by clicking the 'Stop clock' button and then clicking the 'Start clock' button again. The moving object will not jump back to the origin when you click the 'Start clock' button again. The object will start the new graph with the object located at its current location. In fact, any time that the clock is stopped, you can drag the object to a new starting point on the x-axis before restarting the clock. In this way you can experiment drawing x vs. t graph with the object a different original positions.

