Area of the a vs. t Graph, Change in Velocity
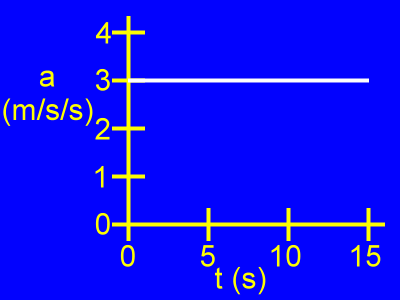
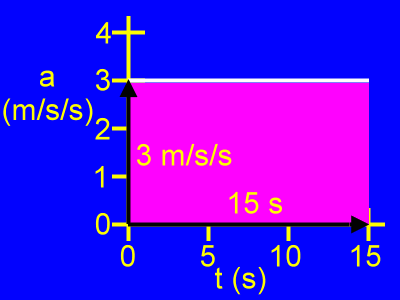
Here we see an acceleration vs. time graph, or an a vs. t graph.
Acceleration (a) is vertical.
Time (t) is horizontal.
The object is moving with a constant acceleration of 3 m/s/s as the time passes from 0 s to 15 s.
Let's understand the meaning of the area of this graph.
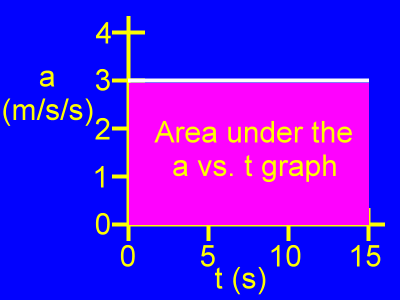
This is the area under this a vs. t graph.
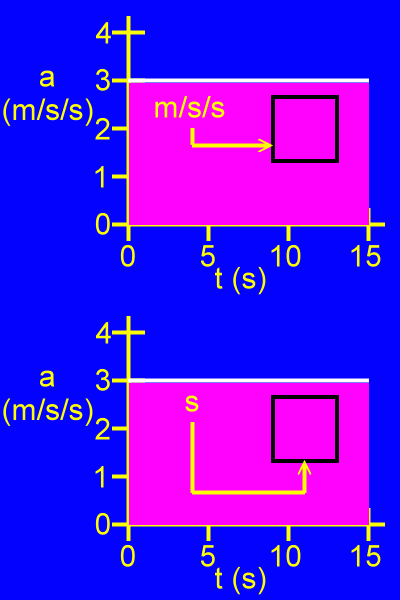
If we examine a section of this area, we notice that vertically it is measured in units of meters per second per second, or meters per second squared.
We also notice that horizontally it is measured in units of seconds.
The actual unit for the area will be units of meters per second per second times seconds. This comes out to be units of meters per second.
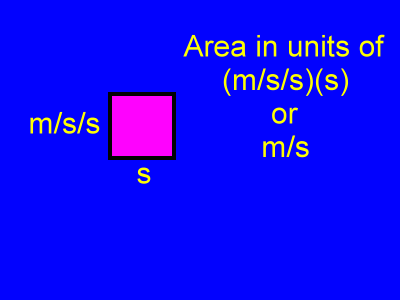
Here we see that along one edge of the area the units are meters per second per second. Along the other edge the units are seconds.
When values measured in these two units are multiplied to find the area, the result has units of meters per second per second times seconds. This results in a unit for meters per second. The seconds cancel.
Therefore, this area is in units of meters per second. It stands for change in velocity, which is measured in meters per second.
Here is the way an actual calculation for the change in velocity of an object would proceed given this a vs. t graph for the object's motion:
For the time period from 0 s to 15 s the area under the v vs. t graph is a rectangle. This rectangle is 3 m/s/s tall, and it is 15 s long.
Therefore, the area is equal to 3 m/s/s times 15 s, or 45 m/s.
45 m/s = (3 m/s/s)(15 s)
The change in velocity for this object is 45 m/s.
change in velocity = delta v = Δv = 45 m/s