XVA - Constant Velocity 2
Back XVA Library Home XVA Kinematics Physics Contents Index Home
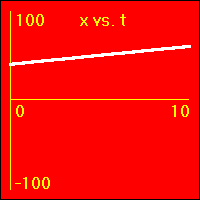
Here we are looking at the motion of an object which is traveling at a constant velocity. This is the second of two main pages that deal with constant velocity graphs. On this page the original position of the object is not at the origin, but at some positive or negative coordinate.
There are four groups of graphs on this page. Each group is numbered, [1] to [4].
Every group has three sets of graphs.
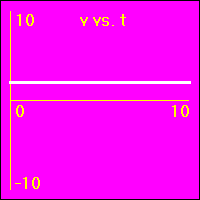
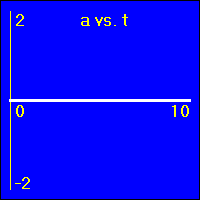
Each set of graphs consists of an x vs. t graph, a v vs. t graph, and an a vs. t graph.
For every graph the original position or the original velocity or the constant acceleration is noted above the corresponding graph.
[1] Starting positive position, several constant positive velocities.
- In each set of graphs the original position is at 40.0 m.
- In each set of graphs the velocity is constant and positive.
- The constant positive velocity becomes more positive as you move from the top set to the bottom set of graphs.
- Since all of the velocities are constant, all of the accelerations are 0.0 m/s2.
| Parameters: | |||||||||||||||||||||||||||
|
|||||||||||||||||||||||||||
This XVA demonstration is set up for the center set of graphs. You should run it several times changing the original velocity each time so as to generate a similar set of graphs. To generate graphs like those above be sure to leave the constant acceleration set to 0.0 m/s2. |
|||||||||||||||||||||||||||
Comments:
- In each of the above x vs. t graphs the object starts out at the same positive position, x = 40.0 m.
- Since each velocity is positive, in each x vs. t graph the object moves away from its starting point in a positive direction. That is, the positions are added to.
- In each set of graphs the object moves away from its starting point at a different velocity. The velocities get more positive as you move down through the sets of graphs.
- In each set of graphs the slope of the x vs. t graph is constant and positive. In each set of graphs the value of the velocity is constant and positive. This is because the slope of an x vs. t graph is the velocity.
- As you move down through the v vs. t graphs the values of the velocities get more positive. As you move down through the x vs. t graphs the slopes get more positive. This is because the slope of an x vs. t graph is the velocity.
- See Constant Velocity Animate 2.
[2] Starting positive position, several constant negative velocities.
- In each set of graphs the original position is at 40.0 m.
- In each set of graphs the velocity is constant and negative.
- The constant negative velocity becomes more negative in each set as you move from the top set to the bottom set.
- Since all of the velocities are constant, all of the accelerations are 0.0 m/s2.
| Parameters: | |||||||||||||||||||||||||||
|
|||||||||||||||||||||||||||
This XVA demonstration is set up for the center set of graphs. You should run it several times changing the original velocity each time so as to generate a similar set of graphs. To generate graphs like those above be sure to leave the constant acceleration set to 0.0 m/s2. |
|||||||||||||||||||||||||||
Comments:
- In each of the above x vs. t graphs the object starts out at the same positive position, x = 40.0 m.
- Since each velocity is negative, in each x vs. t graph the object moves away from its starting point in a negative direction. That is, the positions are subtracted from.
- In each set of graphs the object moves away from its starting point at a different velocity. The velocities get more negative as you move down through the sets of graphs.
- In each set of graphs the slope of the x vs. t graph is constant and negative. In each set of graphs the value of the velocity is constant and negative. This is because the slope of an x vs. t graph is the velocity.
- As you move down through the v vs. t graphs the velocities get more negative. As you move down through the x vs. t graphs the slopes get more negative. This is because the slope of an x vs. t graph is the velocity.
- See Constant Velocity Animate 2.
[3] Starting negative position, several constant positive velocities.
- In each set of graphs the original position is at -40.0 m.
- In each set of graphs the velocity is constant and positive.
- The constant positive velocity becomes more positive in each set as you move from the top set to the bottom set.
- Since all of the velocities are constant, all of the accelerations are 0.0 m/s2.
| Parameters: | |||||||||||||||||||||||||||
|
|||||||||||||||||||||||||||
This XVA demonstration is set up for the center set of graphs. You should run it several times changing the original velocity each time so as to generate a similar set of graphs. To generate graphs like those above be sure to leave the constant acceleration set to 0.0 m/s2. |
|||||||||||||||||||||||||||
Comments:
- In each of the above x vs. t graphs the object starts out at the same negative position, x = -40.0 m.
- Since each velocity is positive, in each x vs. t graph the object moves away from its starting point in a positive direction. That is, the positions are added to.
- In each set of graphs the object moves away from its starting point at a different velocity. The velocities get more positive as you move down through the sets of graphs.
- In each set of graphs the slope of the x vs. t graph is constant and positive. In each set of graphs the value of the velocity is constant and positive. This is because the slope of an x vs. t graph is the velocity.
- As you move down through the v vs. t graphs the velocities get more positive. As you move down through the x vs. t graphs the slopes get more positive. This is because the slope of an x vs. t graph is the velocity.
- See Constant Velocity Animate 3.
[4] Starting negative position, several constant negative velocities.
- In each set of graphs the original position is at -40.0 m.
- In each set of graphs the velocity is constant and negative.
- The constant negative velocity becomes more negative in each set as you move from the top set to the bottom set.
- Since all of the velocities are constant, all of the accelerations are 0.0 m/s2.
| Parameters: | |||||||||||||||||||||||||||
|
|||||||||||||||||||||||||||
This XVA demonstration is set up for the center set of graphs. You should run it several times changing the original velocity each time so as to generate a similar set of graphs. To generate graphs like those above be sure to leave the constant acceleration set to 0.0 m/s2. |
|||||||||||||||||||||||||||
Comments:
- In each of the above x vs. t graphs the object starts out at the same negative position, x = -40.0 m.
- Since each velocity is negative, in each x vs. t graph the object moves away from its starting point in a negative direction. That is, the positions are subtracted from.
- In each set of graphs the object moves away from its starting point at a different velocity. The velocities get more negative as you move down through the sets of graphs.
- In each set of graphs the slope of the x vs. t graph is constant and negative . In each set of graphs the value of the velocity is constant and negative. This is because the slope of an x vs. t graph is the velocity.
- As you move down through the v vs. t graphs the velocities get more negative. As you move down through the x vs. t graphs the slopes get more negative. This is because the slope of an x vs. t graph is the velocity.
- See Constant Velocity Animate 3.
Back XVA Library Home XVA Kinematics Physics Contents Index Home


