XVA - Constant Acceleration 1
Back XVA Library Home XVA Kinematics Physics Contents Index Home
Here we are looking at the motion of an object which is accelerating at a constant value.
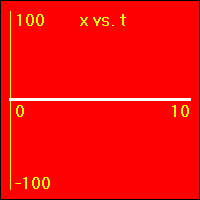
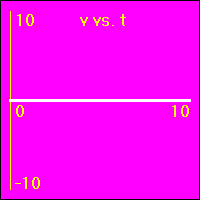
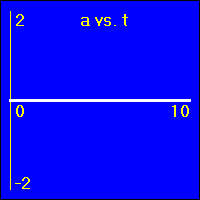
[1] Object is not moving. Starting position is at the origin of the position number line, velocity is constantly zero, acceleration is constantly zero.
| Parameters: | |||||||||
|
|||||||||
| [1] XVA demonstration |
Comments:
- Our starting constant acceleration example shows a 0.0 m/s2 acceleration with a starting velocity of 0.0 m/s. The object stands still.
- See Constant Acceleration Animation 1.
[2]Starting from rest the object experiences a small constant positive acceleration.
Back| Parameters: | |||||||||
|
|||||||||
| [2] XVA demonstration |
Comments:
- The position of the object starts at 0.0 m.
- The velocity of the object starts at 0.0 m/s.
- The constant positive acceleration means that the velocity is added to. This causes the velocity to become more and more positive as time passes.
- The object speeds up in a positive direction.
- Since the value of the velocity is always positive, (except at vo = 0.0 m/s), and becomes increasingly more positive as time passes, the slope of the x vs. t graph is positive and becomes increasingly more positive as time passes. This is because the slope of the x vs. t graph is the velocity.
- Note that the x vs. t graph is curved since its slope is ever increasing as the velocity ever increases.
- Since the value of the acceleration is constant and positive, the slope of the v vs. t graph is constant and positive. This is because the slope of the v vs. t graph is the acceleration.
- See Constant Acceleration Animation 1.
[3]Starting from rest the object experiences a medium constant positive acceleration.
Back| Parameters: | |||||||||
|
|||||||||
| [3] XVA demonstration |
Comments:
- This example is much like the one in [2] except here the acceleration is a greater positive value.
- The slope of the v vs. t graph here is greater than in [2].
- See Constant Acceleration Animation 1.
[4]Starting from rest the object experiences a large constant positive acceleration.
Back| Parameters: | |||||||||
|
|||||||||
| [4] XVA demonstration |
Comments:
- The velocity of the object starts out at 0.0 m/s.
- The positive acceleration means that the velocity is added to. This causes the velocity to become more and more positive as time passes.
- The addition to the velocity here is greater than in [3].
- The object speeds up in a positive direction.
- Since the value of the velocity is always positive, (except vo = 0.0 m/s), and increasingly more positive, the slope of the x vs. t graph is positive and increasingly more positive. This is because the slope of the x vs. t graph is the velocity.
- The increasing of the slope of the x vs. t graph here proceeds more rapidly than in [3].
- Since the value of the acceleration is constant and positive, the slope of the v vs. t graph is constant and positive. This is because the slope of the v vs. t graph is the acceleration.
- Since the acceleration here is greater than in [3], the slope of the v vs. t graph here is greater than in [3].
- See Constant Acceleration Animation 1.
[5]Starting from rest the object experiences a small constant negative acceleration.
Back| Parameters: | |||||||||
|
|||||||||
| [5] XVA demonstration |
Comments:
- The negative acceleration means that the velocity is subtracted from. This causes the velocity to become more and more negative as time passes.
- The object speeds up in a negative direction.
- Since the value of the velocity is always negative, (except vo = 0.0 m/s), and increasingly more negative, the slope of the x vs. t graph is negative and increasingly more negative. This is because the slope of the x vs. t graph is the velocity.
- Since the value of the acceleration is constant and negative, the slope of the v vs. t graph is constant and negative. This is because the slope of the v vs. t graph is the acceleration.
- See Constant Acceleration Animation 1.
[6]Starting from rest the object experiences a medium constant negative acceleration.
| Parameters: | |||||||||
|
|||||||||
| [6] XVA demonstration |
Comments:
- The negative acceleration means that the velocity is subtracted from. This causes the velocity to become more and more negative as time passes.
- The subtraction from the velocity here is greater than in [5].
- The object speeds up in a negative direction.
- Since the value of the velocity is always negative, (except vo = 0.0 m/s), and increasing, the slope of the x vs. t graph is negative and increasing. This is because the slope of the x vs. t graph is the velocity.
- The increasing of the slope of the x vs. t graph here proceeds more rapidly than in [5].
- Since the value of the acceleration is constant and negative, the slope of the v vs. t graph is constant and negative. This is because the slope of the v vs. t graph is the acceleration.
- Since the acceleration here is greater than in [5], the slope of the v vs. t graph here is greater than in [5].
- See Constant Acceleration Animation 1.
[7] Starting from rest the object experiences a large constant negative acceleration.
| Parameters: | |||||||||
|
|||||||||
| [7] XVA demonstration |
Comments:
- The negative acceleration means that the velocity is subtracted from. This causes the velocity to become more and more negative as time passes.
- The subtraction from the velocity here is greater than in [6].
- The object speeds up in a negative direction.
- Since the value of the velocity is always negative, (except vo = 0.0 m/s), and increasing, the slope of the x vs. t graph is negative and increasing. This is because the slope of the x vs. t graph is the velocity.
- The increasing of the slope of the x vs. t graph here proceeds more rapidly than in [6].
- Since the value of the acceleration is constant and negative, the slope of the v vs. t graph is constant and negative. This is because the slope of the v vs. t graph is the acceleration.
- Since the acceleration here is greater than in [6], the slope of the v vs. t graph here is greater than in [6].
- See Constant Acceleration Animation 1.
[8] Starting with a positive velocity the object experiences zero acceleration.
| Parameters: | |||||||||
|
|||||||||
| [8] XVA demonstration |
Comments:
- The velocity starts out with a positive value and remains at this positive value.
- The zero acceleration means that the velocity remains constant.
- The object moves in a positive direction without changing speed.
- Since the value of the velocity is positive and constant, the slope of the x vs. t graph is positive and constant. This is because the slope of the x vs. t graph is the velocity.
- Since the value of the acceleration is constantly zero, the slope of the v vs. t graph is constantly zero. This is because the slope of the v vs. t graph is the acceleration.
- See Constant Acceleration Animation 2.
[9] Starting with a positive velocity the object experiences a small constant positive acceleration.
| Parameters: | |||||||||
|
|||||||||
| [9] XVA demonstration |
Comments:
- This is much like example [2], except the object starts out with a positive velocity rather than starting out with zero velocity.
- See Constant Acceleration Animation 2.
[10] Starting with a positive velocity the object experiences a medium constant positive acceleration.
| Parameters: | |||||||||
|
|||||||||
| [10] XVA demonstration |
Comments:
- This is much like example [3], except the object starts out with a positive velocity rather than starting out with zero velocity.
- See Constant Acceleration Animation 2.
[11] Starting with a positive velocity the object experiences a large constant positive acceleration.
| Parameters: | |||||||||
|
|||||||||
| [11] XVA demonstration |
Comments:
- This is much like example [4], except the object starts out with a positive velocity rather than starting out with zero velocity.
- See Constant Acceleration Animation 2.
[12]Starting with a positive velocity the object experiences a small constant negative acceleration.
Back| Parameters: | |||||||||
|
|||||||||
| [12] XVA demonstration |
Comments:
- The original velocity is positive.
- The negative acceleration means that the velocity is subtracted from. This causes the velocity to become less and less positive until it becomes zero, then, as it is further subtracted from, the velocity becomes negative, (the object's motion reverses direction).
- The object is originally positioned at the origin of the position number line. It moves forward slowing down, eventually stopping for a moment. Then, it turns around, and the direction of its motion reverses.
- Since the value of the velocity is at first positive, then zero for a moment, and finally negative, the slope of the x vs. t graph is positive at first, zero for a moment, and ends up negative. This is because the slope of the x vs. t graph is the velocity.
- Since the value of the acceleration is constant and negative, the slope of the v vs. t graph is constant and negative. This is because the slope of the v vs. t graph is the acceleration.
- See Constant Acceleration Animation 2.
[13]Starting with a positive velocity the object experiences a medium constant negative acceleration.
| Parameters: | |||||||||
|
|||||||||
| [13] XVA demonstration |
Comments:
- This is much like example [12], except here the acceleration is more negative causing the velocity to become zero and then negative in less time than in [12].
- See Constant Acceleration Animation 2.
[14] Starting with a positive velocity the object experiences a large constant negative acceleration.
| Parameters: | |||||||||
|
|||||||||
| [14] XVA demonstration |
Comments:
- This is much like example [12]and [13], except here the acceleration is more negative than in both of those cases causing the velocity to become zero and then negative in less time than in [12]and [13].
- See Constant Acceleration Animation 2.
[15] Starting with a negative velocity the object experiences zero acceleration.
| Parameters: | |||||||||
|
|||||||||
| [15] XVA demonstration |
Comments:
- The velocity starts out with a negative value and remains at this negative value.
- The zero acceleration means that the velocity remains constant.
- The object moves in a negative direction without changing speed.
- Since the value of the velocity is negative and constant, the slope of the x vs. t graph is negative and constant. This is because the slope of the x vs. t graph is the velocity.
- Since the value of the acceleration is constantly zero, the slope of the v vs. t graph is constantly zero. This is because the slope of the v vs. t graph is the acceleration.
- See Constant Acceleration Animation 3.
[16]Starting with a negative velocity the object experiences a small constant positive acceleration.
Back| Parameters: | |||||||||
|
|||||||||
| [16] XVA demonstration |
Comments:
- The original velocity is negative.
- The positive acceleration means that the velocity is added to. This causes the velocity to become less and less negative until it becomes zero, then, as it is further added to, the velocity becomes positive, (the object's motion reverses direction).
- The object is originally positioned at the origin of the position number line. It moves backward slowing down, eventually stopping for a moment. Then, it turns around, and the direction of its motion reverses.
- Since the value of the velocity is at first negative, then zero for a moment, and finally positive, the slope of the x vs. t graph is negative at first, zero for a moment, and ends up positive. This is because the slope of the x vs. t graph is the velocity.
- Since the value of the acceleration is constant and positive, the slope of the v vs. t graph is constant and positive. This is because the slope of the v vs. t graph is the acceleration.
- See Constant Acceleration Animation 3.
[17]Starting with a negative velocity the object experiences a medium constant positive acceleration.
Back| Parameters: | |||||||||
|
|||||||||
| [17] XVA demonstration |
Comments:
- This is much like example [16], except here the acceleration is more positive causing the velocity to become zero and then positive in less time than in [16].
- See Constant Acceleration Animation 3.
[18] Starting with a negative velocity the object experiences a large constant positive acceleration.
| Parameters: | |||||||||
|
|||||||||
| [18] XVA demonstration |
Comments:
- This is much like example [16]and [17], except here the acceleration is more positive than in both of those cases causing the velocity to become zero and then positive in less time than in [16]and [17].
- See Constant Acceleration Animation 3.
[19]Starting with a negative velocity the object experiences a small constant negative acceleration.
Back| Parameters: | |||||||||
|
|||||||||
| [19] XVA demonstration |
Comments:
- The original position is at zero on the position number line.
- The original velocity is negative.
- The negative acceleration means that the velocity is subtracted from. This causes the velocity to become more and more negative as time passes.
- The object speeds up in a negative direction.
- Since the value of the velocity is always negative, (except vo = 0.0 m/s), and increasingly more negative, the slope of the x vs. t graph is negative and increasingly more negative. This is because the slope of the x vs. t graph is the velocity.
- Since the value of the acceleration is constant and negative, the slope of the v vs. t graph is constant and negative. This is because the slope of the v vs. t graph is the acceleration.
- See Constant Acceleration Animation 3.
[20]Starting with a negative velocity the object experiences a medium constant negative acceleration.
Back| Parameters: | |||||||||
|
|||||||||
| [20] XVA demonstration |
Comments:
- This example is much like the one in [19] except here there is a greater negative acceleration causing the velocity to be subtracted from by a greater amount each second, and, thus, causing the object to speed up more rapidly in a negative direction than in [19].
- See Constant Acceleration Animation 3.
[21] Starting with a negative velocity the object experiences a large constant negative acceleration.
| Parameters: | |||||||||
|
|||||||||
| [21] XVA demonstration |
Comments:
- This example is much like the ones in [19] and [20] except here there is a greater negative acceleration causing the velocity to be subtracted from by a greater amount each second, and, thus, causing the object to speed up more rapidly in a negative direction than in [19] and [20].
- See Constant Acceleration Animation 3.
Back XVA Library Home XVA Kinematics Physics Contents Index Home


