XVA - Constant Velocity 1
Back XVA Library Home XVA Kinematics Physics Contents Index Home
We are looking at the motion of an object which is traveling at a constant velocity. This is the first of two main pages that deal with constant velocity graphs.
We are mostly concerned with the relationship between the x vs. t graph and the v vs. t graph.
Each set of graphs will have a different value for the constant velocity. Therefore, all of the accelerations on this page are zero, or 0.0 m/s2. So, all of the a vs. t graphs appear the same. We are not much concerned here with the a vs. t graphs. Our discussion will center around the relationship between the x vs. t and the v vs. t graphs.
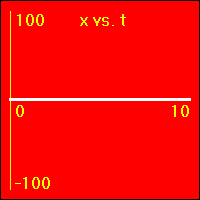
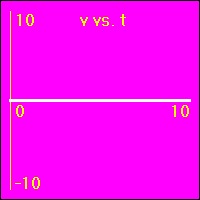
[1] Here is the first of our constant velocity examples. The object starts at the origin of its position number line. The object's velocity is 0.0 m/s to start with, and it remains at this value. So, the object does not move. Since its velocity does not change, the acceleration is 0.0 m/s2 throughout the motion.
| Parameters: | |||||||||
|
|||||||||
| [1] XVA demonstration |
Comments:
- The object is standing still. This first set of graphs looks just like the first set in the constant position section. Here, however, the emphasis is on noting that the velocity remains constant at a value of 0.0 m/s. This, of course, causes the object to remain stationary.
- In all three of the above graphs the graph line of the function is drawn directly over the time axis. It may at first be difficult to see that there is actually data shown on these graphs.
- See Constant Velocity Animate 1.
[2]The object starts at the origin of its position number line. At the start the object's velocity is 2.0 m/s, and it remains at this value. So, the object moves away from the origin at a constant speed in a positive direction. Since the velocity of the object does not change, its acceleration is 0.0 m/s2 throughout the motion.
Back| Parameters: | |||||||||
|
|||||||||
| [2] XVA demonstration |
Comments:
- The object is moving with a positive constant velocity of 2.0 m/s. Note that the slope of the x vs. t graph is positive and constant. The slope of the x vs. t graph is the velocity. So, the slope of the x vs. t graph is 2.0 m/s here.
- See Constant Velocity Animate 1.
[3]The object starts at the origin of its position number line. At the start the object's velocity is 4.0 m/s, and it remains at this value. Thus, the object moves away from the origin at a constant speed in a positive direction. Since the velocity of the object does not change, its acceleration is 0.0 m/s2 throughout the motion.
Back| Parameters: | |||||||||
|
|||||||||
| [3] XVA demonstration |
Comments:
- This example is a lot like the one in [2], except here the constant positive velocity is greater, as is the slope of the x vs. t graph.
- See Constant Velocity Animate 1.
[4] The object starts at the origin of its position number line. At the start the object's velocity is 6.0 m/s, and it remains at this value. Thus, the object moves away from the origin at a constant speed in a positive direction. Since the velocity of the object does not change, its acceleration is 0.0 m/s2 throughout the motion.
| Parameters: | |||||||||
|
|||||||||
| [4] XVA demonstration |
Comments:
- This example is a lot like the ones in [2]and [3], except here the constant positive velocity is greater than either of those, and, so is the slope of the x vs. t graph.
- See Constant Velocity Animate 1.
[5]The object starts at the origin of its position number line. At the start the object's velocity is -2.0 m/s, and it remains at this value. Thus, the object moves away from the origin at a constant speed in a negative direction. Since the velocity of the object does not change, its acceleration is 0.0 m/s2 throughout the motion.
Back| Parameters: | |||||||||
|
|||||||||
| [5] XVA demonstration |
Comments:
- The object is moving with a negative constant velocity. Note that the slope of the x vs.. t graph is negative and constant. The slope of the x vs. t graph is the velocity. So, the slope of the x vs. t graph is -2.0 m/s here.
- See Constant Velocity Animate 1.
[6]The object starts at the origin of its position number line. At the start the object's velocity is -4.0 m/s, and it remains at this value. So, the object moves away from the origin at a constant speed in a negative direction. Since the velocity of the object does not change, its acceleration is 0.0 m/s2 throughout the motion.
Back| Parameters: | |||||||||
|
|||||||||
| [6] XVA demonstration |
Comments:
- This example is a lot like the one in [5], except here the constant negative velocity is larger, or more negative, as is the slope of the x vs. t graph.
- See Constant Velocity Animate 1.
[7] The object starts at the origin of its position number line. At the start the object's velocity is -6.0 m/s, and it remains at this value. Thus, the object moves away from the origin at a constant speed in a negative direction. Since the velocity of the object does not change, its acceleration is 0.0 m/s2 throughout the motion.
| Parameters: | |||||||||
|
|||||||||
| [7] XVA demonstration |
Comments:
- This example is a lot like the ones in [5]and [6], except here the constant negative velocity is yet more negative than either of those, and so is the slope of the x vs. t graph.
- See Constant Velocity Animate 1.
Back XVA Library Home XVA Kinematics Physics Contents Index Home


